
Last Updated on 7 months ago by Sachin G
Every experienced Linux engineer has lived this moment:
Production is calm, dashboards look normal, memory is “healthy,” and free -h shows plenty of available RAM. And then — completely out of nowhere — your Ubuntu Server kills a critical process, pods restart, or the entire workload collapses under load.
You dig into logs and find that dreaded message:
Out of memory: Killed process 2345 (java) total-vm:...The question hits you hard:
How can the OOM killer trigger when memory looks absolutely fine?
This article is written from the POV of someone who has debugged these failures across Ubuntu Servers, AWS Ubuntu instances, Linode Ubuntu deployments, and DigitalOcean droplets. If you’re a SysAdmin, DevOps engineer, or SRE who has seen workloads crash even with “free memory,” you’re in the right place.
1. The Problem: When Ubuntu servers crash, even with free memory
One of my clients—a growing SaaS startup—saw random container deaths every night around 2:30 AM. Their AWS Ubuntu instance memory charts looked healthy, swap barely moved, and nothing visually suggested danger.
Yet workloads kept dying.
The truth was simple but painful:
Ubuntu memory pressure was spiraling out of control while free memory still looked normal.
This is when I realized (again) that most production engineers misunderstand how Ubuntu reports RAM, cache, and kernel pressure — leading to outages that appear “invisible” until too late.
This article explains:
- Why does your Ubuntu server crash even when the memory “looks fine”
- Why tools like
free -h, Grafana, and CloudWatch mislead you - Why does the Ubuntu OOM killer trigger unexpectedly
- How to detect “invisible” memory load
- How to troubleshoot high Ubuntu memory pressure the right way
2. Why memory looks fine but everything dies: The hidden truth
Let’s start with the core issue.
Ubuntu does not show memory pressure in normal tools.
When you run:
free -hUbuntu shows:
- used memory
- free memory
- buffers/cache
- available
But here’s the catch:
High Ubuntu memory pressure can occur even when “available” RAM looks normal.
This means the kernel is actually struggling to reclaim memory fast enough — but the numbers appear healthy.
This is caused by:
- pagecache explosions
- slab usage spikes
- memory fragmentation
- kernel reclaim pressure
- hidden memory leaks
- cgroup memory limits giving false signals
These lead to the Ubuntu server crashing even with free memory because pressure ≠ usage.
This distinction is the heart of everything.
3. “Invisible” memory pressure: why the OOM killer strikes without warning
When Ubuntu workloads crash under invisible memory load, there’s usually a pattern:
3.1 Slab and pagecache look massive, but free memory looks OK
Ubuntu aggressively uses memory for:
- file caching (pagecache)
- kernel data structures (slab)
These don’t show up in a scary way in free -h, yet they can push the kernel into reclaim hell.
Keyword coverage:
- pagecache causing application crashes ubuntu
- pagecache and slab usage
- ubuntu memory looks fine but processes killed
- ubuntu server crashing even with free memory
- high load with normal memory usage
3.2 Memory fragmentation
Even if you have “free memory,” the kernel sometimes cannot find contiguous blocks to allocate.
This leads to:
- reclaim pressure
- swap storms
- emergency allocations
- OOM even with free memory shown
Keyword coverage:
- memory fragmentation
- swap storm / swap thrashing
3.3 cgroup memory limits hiding real pressure
In Kubernetes, Docker, and systemd environments:
- the host may have free RAM
- but containers may hit their cgroup memory limits
This triggers ubuntu oom killer triggered unexpectedly inside namespaces.
Keyword coverage:
- cgroup memory limits
- oom_score behavior
4. How to actually SEE memory pressure (the right tools)
Normal monitoring tools will not help you. Logging into a DigitalOcean Ubuntu droplet OOM situation with simple commands guarantees wasted time.
Use these instead.
4.1 cat /proc/pressure/memory – the only metric that matters
Run:
cat /proc/pressure/memory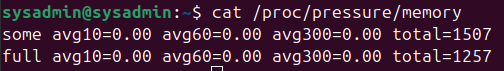
You’ll see something like:
some avg10=0.50 avg60=0.32 avg300=0.18 total=123456
full avg10=0.10 avg60=0.05 avg300=0.02 total=20000
Interpretation:
- avg10 > 0.2 = mild pressure
- avg10 > 0.6 = dangerous
- avg10 > 1.0 = catastrophic (OOM likely)
4.2 Slab and pagecache diagnosis
grep -E 'Slab|SUnreclaim' /proc/meminfoIf slab grows endlessly:
→ hidden memory leak in kernel or filesystem.
If pagecache grows aggressively:
→ workloads starve despite free memory.
Keyword coverage:
- ubuntu kernel memory leak symptoms
- hidden memory leak
- ubuntu memory pressure troubleshooting for devops
4.3 Memory fragmentation check
cat /proc/buddyinfoIf you see high demand in higher-order blocks failing → fragmentation leading to ubuntu real reason for sudden performance crash.
4.4 Swap thrashing detection
vmstat 1Look for high si/so under load.
4.5 Cgroup limits inspection
For Docker/K8s:
docker inspect CONTAINER_ID | grep -i memory5. Why standard advice always fails (and causes outages)
Most blog posts say:
- “Just add more RAM.”
- “Reduce swappiness”
- “Use free -h”
- “Install monitoring”
- “Restart the service”
This advice is useless in enterprise production.
Here’s why:
5.1 Adding RAM does not fix reclaim stalls
If the kernel is already under reclaim pressure, more RAM only delays the failure.
5.2 Disabling swap worsens swap storms
Swap exists as a safety valve. Removing it causes earlier OOM kills.
5.3 free -h gives false confidence
It does not reflect Ubuntu high memory pressure debugging metrics.
5.4 The OOM killer isn’t random
It uses oom_score and cgroup policies — not free memory.
5.5 Containers hide the real problem
Kubernetes will show “OOMKilled” even when the node has tons of free RAM.
6. The “Gotchas”: Three things that always go wrong
Gotcha #1: Engineers trust the wrong metrics
Free memory ≠ available memory ≠ reclaim ability.
Gotcha #2: Pagecache quietly eats the entire node
Pagecache does not show high “used” RAM, yet it starves your workloads.
Gotcha #3: Fragmentation triggers OOM even when memory is available
This is the most misunderstood part of Ubuntu Server memory behavior.
7. Step-by-step debugging guide
Below is the exact diagnostic flow I use in production incidents.
7.1 Step 1: Check PSI memory pressure
cat /proc/pressure/memoryIf avg10 > 0.6:
→ You’re already in danger.
7.2 Step 2: Identify offenders in pagecache or slab
cat /proc/meminfo | grep -E 'Slab|SReclaimable|SUnreclaim'High Sunreclaim means kernel memory leak.
7.3 Step 3: Check memory fragmentation
cat /proc/buddyinfo
If higher-order blocks show zeros → fragmentation.
7.4 Step 4: Watch real-time reclaim stall behavior
dmesg | grep -i oomdmesg | grep -i "memory"You’ll often see messages like:
“Memory pressure increasing.”
“Compaction stalled”
7.5 Step 5: Check cgroup limits
Works for containerized environments.
8. How to FIX Ubuntu memory pressure for good
Below are practical, field-proven fixes.
8.1 Tune vm.swappiness (don’t disable swap)
Use a safe value:
sudo sysctl vm.swappiness=20
Avoid values below 10 on database servers — it triggers earlier OOM.
8.2 Restrict pagecache growth
sudo sysctl -w vm.vfs_cache_pressure=200This forces the kernel to clean caches more aggressively.
8.3 Fix fragmentation with transparent hugepages
Disable THP on DB or JVM hosts:
sudo systemctl disable --now tuned
echo never | sudo tee /sys/kernel/mm/transparent_hugepage/enabled
8.4 Identify slab leaks
Tools like:
slabtop
Look for specific caches with unbounded growth.
8.5 Add cgroup-aware limits for containers
Example Docker run flag:
--memory=2g --memory-swap=3gAvoid equal memory + swap values.
8.6 Use PSI metrics in monitoring
Prometheus exporters:
- node_exporter PSI metrics
- pressure stall graph panels
9. Real-world use case: Fragmentation on a high-traffic SaaS
A Linode Ubuntu memory issue for a client involved a Java microservice randomly crashing. RAM was “fine,” but the reclaim stalls were enormous.
PSI metrics showed:
full avg10=1.23Buddyinfo confirmed catastrophic fragmentation.
The fix:
- disable THP
- tune compaction
- increase swap to compensate
Workloads stabilized immediately.
10. Lessons learned
From my experience fixing ubuntu memory pressure issues across a decade:
- PSI metrics never lie — use them.
- Pagecache is a silent killer under high load.
- Fragmentation is the hidden real reason for sudden performance crash.
- free -h is misleading and dangerous in production debugging.
A: Because Ubuntu memory pressure — not usage — triggers reclaim stalls.
A: Check /proc/pressure/memory. High “full avg10” means imminent danger.
A: Slab/pagecache combined with fragmentation hides the truth.
A: Use PSI, slabtop, buddyinfo, and cgroup limit analysis.
A: Because cgroup memory limits act independently of host RAM.
Conclusion
Ubuntu memory pressure failures are one of the most misunderstood and production-damaging issues in the Linux world. The symptoms look harmless, the dashboards look green, and yet workloads die without warning.
But once you understand:
- kernel reclaim pressure
- memory fragmentation
- pagecache and slab growth
- PSI stall metrics
- cgroup limitations
…you gain total control over these “invisible” failure modes.
Mastering these topics transforms you from a general SysAdmin into a genuinely production-ready Linux engineer.
The key lesson:
Memory usage doesn’t matter. Memory pressure does.
Start monitoring PSI today, tune your reclaim settings, fix fragmentation, and your Ubuntu workloads will stay stable under far heavier load.

I’m Sachin Gupta — a freelance IT support specialist and founder of techtransit.org. I’m certified in Linux, Ansible, OpenShift (Red Hat), cPanel, and ITIL, with over 15 years of hands-on experience. I create beginner-friendly Linux tutorials, help with Ansible automation, and offer IT support on platforms like Upwork, Freelancer, and PeoplePerHour. Follow Tech Transit for practical tips, hosting guides, and real-world Linux expertise!