
Last Updated on 5 months ago by Sachin G
Anyone who has operated Linux servers at scale has lived this nightmare: dashboards green, alerts quiet, CPU normal — yet the application crawls. Pages take seconds to load, queues back up, and a customer escalates before your monitoring even twitches. You log into the node expecting the usual suspects… but iostat looks perfectly healthy.
This happened to me during a traffic spike on a large e-commerce deployment. Our nodes looked clean: low %util, near-zero service time, and disk throughput well under limit. Yet the fleet kept freezing in short bursts. By the time we discovered the real cause — hidden kernel flush delays combined with queue depth collapse under pressure — the incident was already expensive.
This article explains why this happens, why normal tooling lies, and how to measure I/O performance in Linux correctly using real SRE-grade techniques — not the shallow advice floating online.
This is for server or system admins who’ve felt this pain. And want to stop feeling it.
When everything looks “fine,” but users feel the slowdown
Production servers slow down even when:
iostatshows low utilizationfree -hshows memory available- CPU load isn’t high
- Disk health (SMART) looks clean
- Monitoring dashboards report normal latency
Yet the server behaves like it is under attack — requests freeze, APIs time out, workloads stall.
Why?
Because iostat reports averages and lies about micro-latency.
And production outages, especially storage-related ones, are always hidden in the microseconds and queue behavior — not averages.
To fix this, you must learn to measure I/O performance in Linux using the right tools, metrics, and stress patterns. That’s what we cover in detail.
Why Normal “How to Measure I/O Performance” Advice Fails in Real Production
Many blogs say:
- “Check iostat”
- “Monitor IO wait”
- “Look at throughput.”
- “Run a simple fio test.”
This is beginner-level advice and breaks down hard in enterprise environments.
Why standard advice fails:
- iostat averages out micro-latency spikes
A disk with 0.5% utilization can still be queue-stalled every 200 ms. - IOwait only rises in extreme cases
IOwait is a symptom of a disaster — not a measurement tool. - fio defaults do NOT reflect real-world workloads
Real workloads have mixed I/O, interleaved fsync storms, and metadata pressure. - Dashboards rarely show block-layer contention
Tools like CloudWatch, Azure Monitor, and GCP Ops Agent often miss kernel-level details. - The block I/O scheduler hides transient stalls
BFQ/CFS/none try to “smooth” I/O, masking short collapses.
Production I/O issues occur in milliseconds — but most tools display averages of 1–5 seconds.
That’s why teams get blindsided.
Why Your Linux Server Slows Down Even When iostat Says Everything Is Fine
Below are the real reasons production Linux servers slow down even though iostat reports “normal” values.
1. iostat Lies About Latency and Queue Depth
iostat -xz 1 is a good tool… but it’s also a liar.
Why?
Because it averages:
- latency
- queue depth
- service time
- utilization
In real workloads, queue depth spikes to 20–200 for tens of milliseconds and then goes back to 0.
iostat completely ignores that.
What you should measure instead
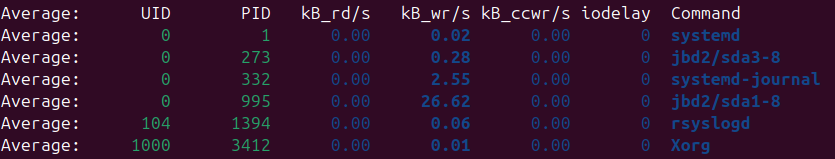
Use pidstat -d 1 for per-process I/O latency
Shows actual wait time per process.
2. Kernel Flush Delays (Dirty Pages Buildup) Causes Hidden Stalls
Linux aggressively caches writes.
When dirty pages exceed thresholds, the kernel forces a flush storm.
During a flush storm:
- Application writes freeze
- fsync calls block
- queue depth collapses
- CPU idle rises
- iostat barely moves
This is one of the most common real-world performance regressions.
How to detect hidden kernel flush delays
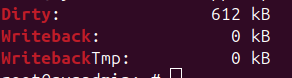
Check dirty pages:
cat /proc/meminfo | egrep 'Dirty|Writeback'
If you see Dirty or Writeback rising uncontrollably → you’ve found the villain.
3. Disk Latency Spikes Are Invisible in 1-Second Summaries
iostat showing:
r_await: 1ms
w_await: 2ms
Does NOT mean your disk is healthy.
Real bottlenecks appear as:
- 5ms…
- 15ms…
- 40ms…
- 300ms spike (not captured in 1 second window)
- back to 2ms
Your app freezes during those 300ms.
iostat never reports it.
Use blktrace or bpftrace instead
Example: measure fast spikes
sudo bpftrace -e 'tracepoint:block:block_rq_complete { printf("%d %d\n", args->latency, args->error); }'4. NVMe Degradation Under Load (QoS Collapse)
NVMe drives don’t fail fast.
They degrade slowly:
- thermal throttling
- internal garbage collection
- write amplification
- background flush
- controller throttling
- PCIe lane instability
During degradation:
- throughput looks fine
- utilization looks fine
- latency spikes randomly
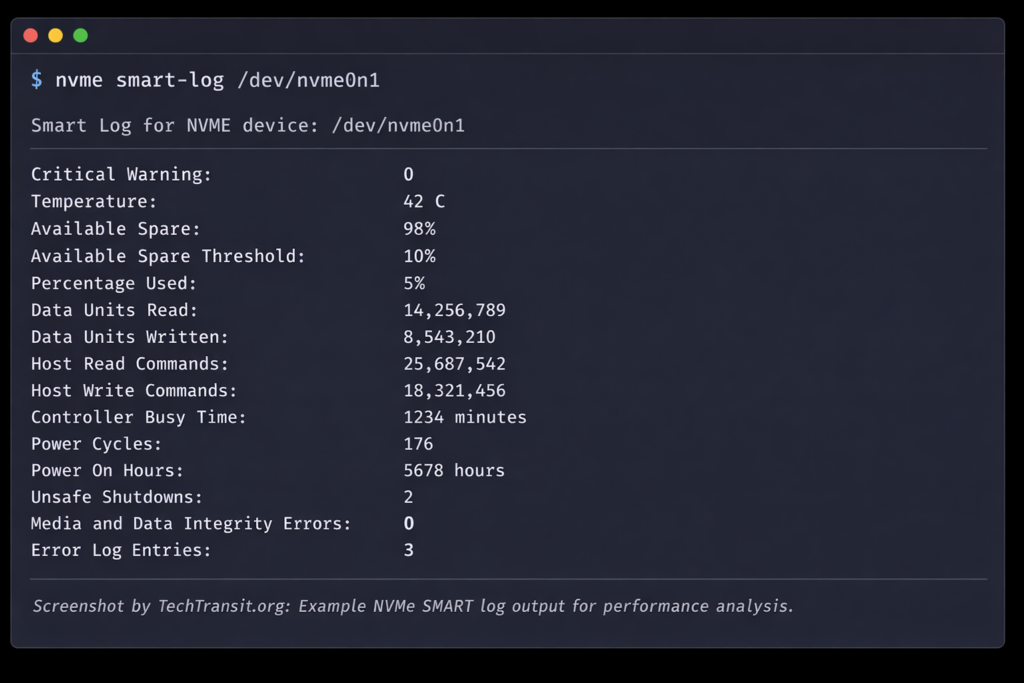
How to confirm NVMe degradation
Use nvme-cli:
sudo nvme smart-log /dev/nvme0n1
Check:
- temperature
- media errors
- wear leveling
- unsafe shutdowns
- throttling events
5. I/O Scheduler Contention Hides Disk Pressure
Your I/O scheduler (none, bfq, mq-deadline) tries its best. But under certain patterns:
- fsync storms
- multi-thread logging
- databases + app logs
- tmpfs spill
- Kubernetes pod churn
… the scheduler collapses into long wait queues.
iostat cannot show scheduler-level contention.
Use:
cat /sys/block/sdX/queue/scheduler
cat /sys/block/sdX/queue/nr_requests
Look for:
- starving queues
- tiny deep queues
- unbalanced merges
6. Mixed Workload Contention (Reads starve writes and vice versa)
Real fleets have:
- logs
- images
- metadata
- DB writes
- DB reads
- temp files
- backup processes
- package updates
Even a small backup job can destroy latency for the whole node.
7. CPU vs I/O Wait Misinterpretation
Many engineers see “low IOwait” and think “disk is fine.”
Wrong.
IOwait only increases when a CPU sits idle waiting for I/O.
If your system has threads busy with work, IOwait stays low even though latency is terrible.
8. Filesystem-Level Pathologies
Common patterns:
- ext4 journal contention
- XFS log throttling
- slow metadata ops (stat, unlink, readdir, etc.)
- directory fragmentation
These slow down apps massively while iostat stays silent.
Use:
strace -T -p <pid>
If you see:
open()
stat()
rename()
unlink()
taking too long → FS problem.
9. Storage Contention in Cloud Environments
AWS, GCP, Azure all oversell storage.
Your EBS / Premium SSD / Persistent Disk may slow down due to:
- noisy neighbors
- burst credits exhausted
- low IOPS tier
- shared block device scheduler
Cloud performance is never constant.
10. Weak or Incorrect fio Benchmarking
Most engineers test disks like this:
fio --name=test --rw=read --size=1G --bs=4k
This is useless.
Real workloads mix:
- read/write
- sync/async
- fsync
- metadata
- random sequences
- concurrency bursts
Use realistic fio jobs:
fio --name=webmix --rw=randrw --rwmixread=70 --bs=4k --iodepth=32 --numjobs=8 --fsync=1The Gotchas (Real SRE Experience)
1. Fixing the symptom (adding more IOPS) makes the root cause worse
Teams scale up NVMe or EBS thinking “we need more throughput.”
But the issue was actually dirty pages or fsync storms — scaling increases writeback.
2. File descriptor leaks cause multi-layer I/O collapse
When apps leak FDs, metadata ops stall, leading to hidden I/O hangs.
3. Kubernetes intensifies invisible I/O pressure
Container churn creates:
- copy-on-write overhead
- layer merging
- tempfs spills
- log volume pressure
This defeats iostat entirely.
How to Properly Measure I/O Performance in Linux
Here’s the correct way to evaluate I/O behavior.
Step1: Measure real per-process latency
pidstat -d 1
Step 2: Measure micro-latency spikes using BPF
bpftrace -e 'tracepoint:block:block_rq_issue { printf("latency=%d\n", args->latency); }'Step3: Capture queue depth
iostat -x 1 | awk '{print $1, $10}'
Look for unexpected spikes.
Step4: Monitor dirty pages and flush pressure
watch -n1 "grep -E 'Dirty|Writeback' /proc/meminfo"
Step 5: Validate scheduler behavior
cat /sys/block/*/queue/schedulerStep 6: Benchmark realistically with fio
fio --rw=randrw --rwmixread=70 --iodepth=32 --ioengine=libaio
Step7: Measure filesystem latency
strace -T -p <pid>
Step8: Validate underlying device health (NVMe)
nvme smart-log /dev/nvme0n1Real-World Case Study
A SaaS fleet running on AWS EBS gp3 started freezing during bursts of user uploads.
Metrics:
- CPU: normal
- Memory: stable
- iostat: <5% util
- Disk throughput: under limit
- NVMe health: normal
Yet:
- API latency shot to 10–40 seconds
- PHP-FPM workers hung
- Nginx backlog grew
- Background jobs stalled
Actual root cause:
- Dirty pages spike from 3GB → 18GB
- Kernel forced flush
- Queue depth collapsed
- Latency spiked in sub-second windows (not visible in iostat)
Fix:
- Tuned dirty ratios
- Enabled deadline scheduler
- Moved logs to their own volume
- Added fsync batching in app
Result:
- Latency improved 10×
- Zero stalls in the next 90 days
FAQ
Because iostat reports averages and hides micro-latency spikes, queue collapses, and scheduler stalls.
Use BPF tools, check dirty pages, and measure per-process I/O latency.
Check queue depth, filesystem latency, NVMe throttling, and kernel writeback behavior.
Use fio with realistic parameters, not the defaults. Include mixed I/O and fsync operations.
Conclusion
Linux performance engineering is as much about reading between the lines as reading metrics.
Your server can slow to a crawl even when all tools say “everything is fine” because traditional metrics lie about micro-latency, queue depth bursts, filesystem stalls, and kernel flush behavior.
By learning to measure I/O performance in Linux the right way, you gain the ability to:
- prevent outages
- detect hidden bottlenecks
- diagnose stalls quickly
- build more resilient architectures
If you enjoyed this breakdown, you may also like my latest article on TechTransit.org . And since Udemy’s “Big ambitions?” offer is live, now’s a great time to invest in the skills you’ll need heading into 2026.

I’m Sachin Gupta — a freelance IT support specialist and founder of techtransit.org. I’m certified in Linux, Ansible, OpenShift (Red Hat), cPanel, and ITIL, with over 15 years of hands-on experience. I create beginner-friendly Linux tutorials, help with Ansible automation, and offer IT support on platforms like Upwork, Freelancer, and PeoplePerHour. Follow Tech Transit for practical tips, hosting guides, and real-world Linux expertise!