


Last Updated on 6 hours ago by Sachin G
I ran my probe count on the server and it said 0. The rule was not even live yet. Yesterday’s log had 305 probes in it. So I knew the zero was wrong before I knew why. I wanted to block .env probes before they reached WordPress, and I almost trusted a number that came from the wrong log file.
In plain words Bots ask WordPress sites for secret files like .env and wp-config. Every request makes your server build an error page. A free Cloudflare rule can stop most of these before they reach your server. It stops the plain requests. Bots that disguise the file name still get through, so keep checking your logs.
Applies to: a client’s WordPress site behind the Cloudflare free plan, Nginx as the origin web server, PHP-FPM, 4 CPU cores. Rule deployed in October 2026. Last tested: November 2026.
This is a real client job, so names and paths below are changed. For the wider picture
Evidence
I found this during a load test. Pages served from the cache were fast, over 4,000 requests per second. Pages that cannot be cached took about 1 second each. On 4 cores the server fills up at about 3 to 4 of those per second.
The PHP worker limit was pm.max_children = 40. The load test did not reach it. Scanner bursts did, twice in one day, about 100 requests in a minute each. Every one of those requests was an error page that WordPress still builds in full.
My baseline count for the day before the rule:
/home/siteuser/logs/nginx/access.log-2026-10-20: 305 probes of 1213 linesThat is 25% of the requests that reached the server. I need to be fair about this number. That day had two bursts. Cloudflare’s own preview for the rule later said 12.37k matching requests in 30 days, 10.6% of total traffic. That is about 400 probes a day. The 10.6% is the more normal figure.
How I diagnosed it
- Load test. It showed that uncached pages are the expensive ones. Cached pages were never the problem.
- The worker limit. The test did not hit it, scanner bursts did. Raising the limit would not help, because the CPU is the real limit. I left
pm.max_childrenat 40. - A grep for hidden-file names. My first try looked at the wrong place and returned zero, twice:
# Count hidden-file probes (this looked at the wrong place)
grep -hE '\.env|\.git|wp-config|\.aws|\.ssh|phpinfo|phpunit|\.DS_Store' /var/log/nginx/*access.log | wc -l
0
The control panel on this server keeps each site’s log in the site user’s home folder, not in /var/log/nginx. This finds them:
# Find the real access logs for each site
ls -lh /home/*/logs/nginx/access.log* 2>/dev/null
With the right log, the baseline above appeared.
The fix: block .env probes in Cloudflare
Backup first. Take a snapshot of the server, or at least write down your current Cloudflare rules. The rule below only blocks, but you should be able to go back.
- In Cloudflare, go to WAF → Custom rules → Create rule.
- Name it
Block scanner probes. - Choose Edit expression and paste this:
(http.request.uri.path contains "/.env") or
(http.request.uri.path contains "/.git") or
(http.request.uri.path contains "wp-config") or
(http.request.uri.path contains "/.aws") or
(http.request.uri.path contains "/.ssh") or
(http.request.uri.path contains "phpinfo") or
(http.request.uri.path contains "/vendor/phpunit") or
(http.request.uri.path contains "/.DS_Store")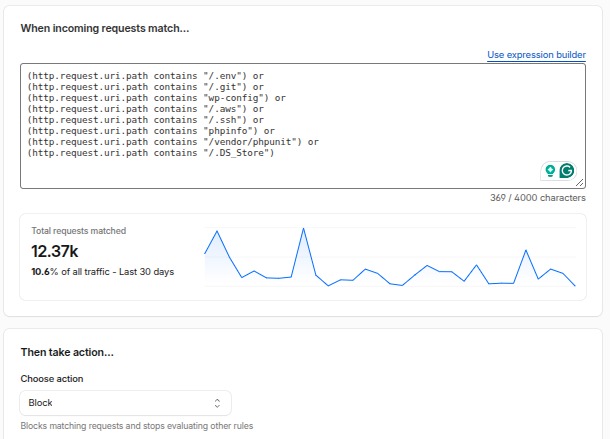
- Set the action to Block. I did not use a challenge. Nothing here needs a human to solve a puzzle.
- Look at the preview before you deploy. Mine showed 12.37k matches in 30 days. None of the paths real visitors use were in it.
- Set the execution order to First, then deploy.
TOOL: cloudflare-waf-builder
Three things I left out on purpose:
/.well-known. SSL and domain verification need it open.xmlrpc.php. I had no record of an app using it, but I was not sure, and it was outside this job.- A
/backupplus.sqlline. Mixingorandandin one expression can bracket wrongly. [
The free plan limits how many custom rules you can have.
How to verify
Open your home page and the pages visitors use. Then count probes per day in the origin log. This is the same grep as before, run over each log:
# Probes at the origin per day (the rule went live on the 21st; the 20th is the baseline)
L=/home/siteuser/logs/nginx
for f in $L/access.log-2026-10-2* $L/access.log; do
  p=$(grep -cE '\.env|\.git|wp-config|\.aws|\.ssh|phpinfo|phpunit|\.DS_Store' "$f")
  t=$(wc -l < "$f")
  echo "$(basename $f): $p of $t"
done
My results, counting probes that still reached the origin:
| Day | Probes | Log lines |
|---|---|---|
| 20 Oct (before the rule) | 305 | 1,213 |
| 21 Oct (rule live from early morning) | 7 | 2,025 |
| 22 Oct | 14 | 1,411 |
| 23 Oct | 23 | 1,404 |
| 24 Oct | 48 | 1,920 |
| 25 Oct | 2 | 961 |
| 26 Oct | 3 | 11,802 |
| 27 Oct | 110 | 14,155 |
| 28 Oct | 0 | 6,765 |
| 29 Oct | 19 | 7,171 |
| 30 Oct | 148 | 7,752 |
| 31 Oct | 0 | 6,182 |
| 1 Nov | 4 | 8,000 |
The 21 Oct count includes the hours before the rule went live. The busiest day after the rule was 24 Oct, at 2.5% of the lines. Most days were well under 1%.
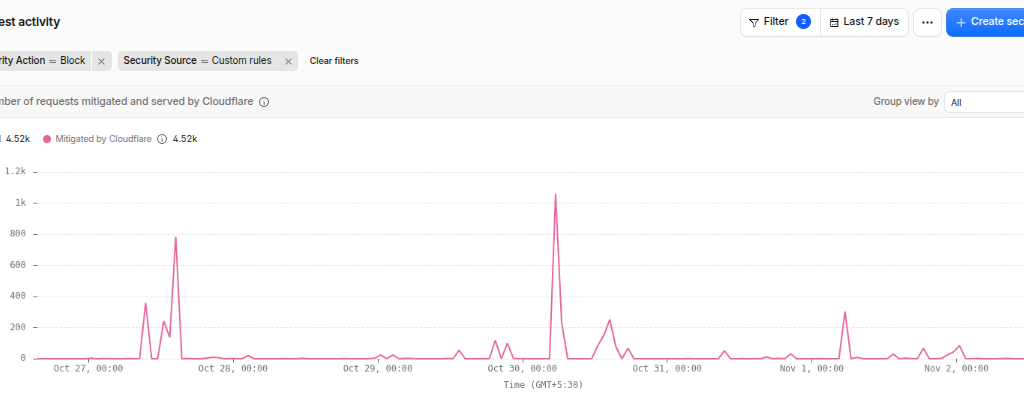
Cloudflare’s own numbers point the same way. In its analytics, filtered to the Block action and the Custom rules source, the last 7 days show 4.52k blocked requests. In my origin logs for 26 Oct to 1 Nov, 284 requests with probe names reached the server (3 + 110 + 0 + 19 + 148 + 0 + 4). The two windows are not identical, so treat this as a rough ratio: about 16 blocked for every one that got through.
What slipped past
The leftovers on 27 and 30 Oct bothered me. I wrote a small script to sort them by how they were written. Here is the version I ran:
python3 -I - <<'EOF'
import re, urllib.parse as u
pat  = re.compile(r'\.env|\.git|wp-config|\.aws|\.ssh|phpinfo|phpunit|\.DS_Store')
rule = re.compile(r'/\.env|/\.git|wp-config|/\.aws|/\.ssh|phpinfo|/vendor/phpunit|/\.DS_Store')
f = '/home/siteuser/logs/nginx/access.log-2026-10-27'
raw = dec = qry = other = 0
for line in open(f, errors='replace'):
    if not pat.search(line): continue
    req = line.split('"')[1]
    target = req.split(' ')[1]
    path, _, query = target.partition('?')
    if rule.search(path): raw += 1
    elif rule.search(u.unquote(path)): dec += 1
    elif pat.search(query): qry += 1
    else: other += 1
print("raw path:", raw, "decoded:", dec, "query:", qry, "other:", other)
EOF
For 27 Oct: 110 matched lines. 0 in the raw path, 4 after decoding once, 6 in the query string and 100 other. For 30 Oct: 148 matched, 0, 9, 16 and 123.
So the rule did exactly what I wrote. Not one plain /.env request got through. What got through was disguised:
GET /config.env
GET /;.env.backup
GET /dashboard%2F.env
GET /%252F.aws%252Fcredentials
GET /?phpinfo
GET /_image?href=/../../../.env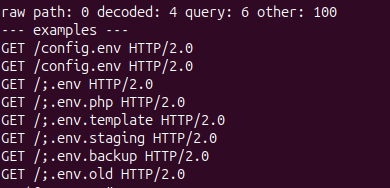
I first thought the 100 “other” lines were false positives from my grep, names like .github. I was wrong. They were real probes. My rule looks for /.env, so config.env does not match. It checks the path only, so the query string is not seen. And %2F or %252F is not a slash to a plain text match.
The 27 Oct burst also had a peak minute. This is the Nginx log, counting matched requests per minute:
96 27/Oct/2026:09:32And this is the PHP-FPM log, in the same minute:
[27-Oct-2026 09:32:29] WARNING: [pool example.com] server reached pm.max_children setting (40), consider raising itSo after the rule, one burst of disguised probes still filled the workers once. The 30 Oct burst peaked at 30 requests a minute and logged no warning that day.
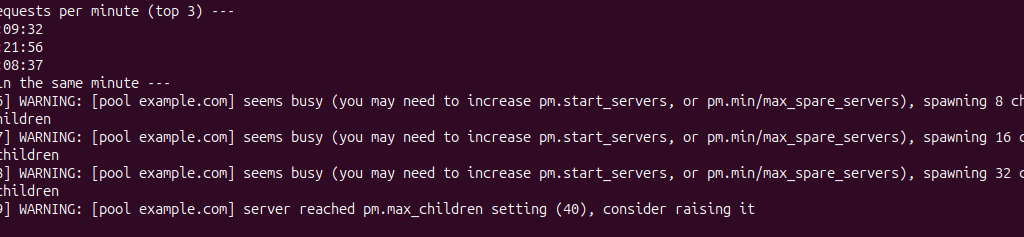
The warning did not come alone. In the three seconds before it, the pool logged “seems busy” with 0 idle workers and went from 27 to 37 children, then hit the limit at 09:32:29.
So after the rule, one burst of disguised probes still filled the workers once. The 30 Oct burst peaked at 30 requests a minute and logged no warning that day.
Gotchas that really happened
- A zero is not proof. My first count was zero before the rule existed. Check that your grep finds anything at all first.
- The baseline day was a bad day. 25% came from a day with two bursts. The 30-day preview said 10.6%.
- Shell maths rounds down. My script printed whole percents. 2.5% showed as 2%. Print the counts.
- The rule reads the path only. It does not see the query string.
contains "/.env"needs the slash.config.envand;.envare different strings.- I blamed the rule for something it did not do. Minutes after deploying, some inner pages looked unstyled. I suspected the new rule. Every stylesheet answered 200 and the rule had logged no events. Regenerating the page builder’s CSS cache fixed it. I never found what broke it.
What I did not test
- Whether a real page path that contains
wp-configorphpinfowould be blocked by mistake. - Whether bots reaching the origin server directly, around Cloudflare, are still a problem.
- A better expression that decodes the path first. I do not know which decoding functions your Cloudflare plan allows.
- Why the 30 Oct burst caused no worker warning.
- Whether blocking
xmlrpc.phpwould have been safe on this site.
I did not look at Cloudflare’s own event count for the rule over the full week, so my numbers come from the origin log only. They show what got through, not what was stopped.